I wanted to do a more in-depth look into Expected Value (EV) and why it is such a critical metric for traders to understand.
Expected Value, or EV, is a statistical concept that helps traders assess the profitability of a strategy based on the historical performance of the setup.
(If you’re interested in more content like this, then make sure to subscribe above!)
A positive EV suggests that, on average, the strategy is expected to generate profits over the long run, while a negative EV indicates the opposite.
In layman terms, this is what you should expect to make on a trade for a given strategy and what you should use as a guideline to understand where and when to take profit.
In this post I will cover:
- How EV is defined and how it is calculated.
- Applying EV to a trading strategy
- How I am using it to refine one of my strategies
- Recent example using EV to make a trade
How Expected Value Is Calculated
EV is an average of how much you win vs how much you lose and is calculated using the following formula:
EV = (Probability of Winning Trade x Avg Win) – (Probability of Losing Trade x Avg Loss)
Let’s break down the components of this formula:
Probability of Winning Trade:
This is the likelihood that a trade will result in a profit. It is calculated by dividing the number of winning trades by the total number of trades executed.
Probability of Winning Trade = Number of winning trades/total number of trades
Average Win:
The average amount gained in winning trades. It is calculated by adding the profits of all winning trades and dividing them by the number of winning trades.Average Win = Total Profit from winning trades/number of winning trades
Probability of Losing Trade:
The likelihood that a trade will result in a loss. It is calculated by dividing the number of losing trades by the total number of trades executed.
Probability of Lowing Trading = Number of lowing trades/total number of trades
Average Loss:
The average amount lost in losing trades. It is calculated by adding the losses of all losing trades and dividing them by the number of losing trades.
Average Loss = Total loss from losing trades/number of losing trades
One important thing to understand with Average Win is that it is not what YOU have made in the trade, but rather the average move the trade makes after entering. I’ll explain this in more detail in the trading strategy section.
Thus, for example, if your trading strategy that has a 60% win rate and gains on average $100 while losing $50 on average, your EV is (.6 x 100) – (.4 x 50) or $60 – $20 = 40.
In this example you can reasonably expect to make $40 from each trade you execute.
Every trader should know what their EV is for each strategy they trade. This is how you know if your strategy has edge.
Furthermore, it helps you understand if your strategy still has edge when market conditions change. Keep in mind that EV is not a static value; it is dynamic or ever-changing. Therefore, by regularly assessing your EV, you can adapt your strategies and improve them based on evolving market conditions.
Now that we understand what EV is and how it works, let us look at a trading strategy and how EV can be applied to it.
Applying EV to a Trading Strategy
Consider for instance, you have been tracking bull flag breakouts on stocks that have a news catalyst, a strong opening drive, pullback to the 10d EMA on the 2 min chart while trading with an RVOL over 3.
You have done your due diligence and collected over 100 trade examples with data points including: open, HOD, LOD, close, entry price, stop price, volume, and Gap%.
You consolidate that data and deduce that you have a win rate of 52% and your average win amounts to $1,000.
In addition, you learn that you lose 48% of the time risking $1,000 per trade.
With that information we can find the EV for this strategy:
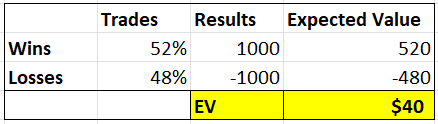
Trading the strategy in its current form results in an average win of $40 per trade over the long run.
BUT can we make improvements to this strategy with the data we have gathered?
What if we found out that we increased our win% to 65% by only taking trades on stocks that gapped up over 5% while still incorporating the other criteria mentioned above?

That is a huge jump in EV just by making a minor change in your strategy based on the data you collected.
Let us take it a step further.
Since you know the average HOD (high of day) on your trades is 2%, you decide to hold a core position for that bigger move.
After having taken a statistically relevant number of trades, you conclude that your win% dropped back down to 55% but your results increased to an average of $1,700 on your winning trades.
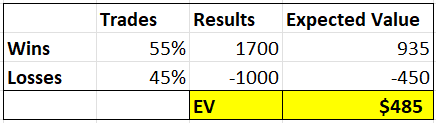
Another huge improvement even though your win% was lower.
Despite this being a hypothetical situation, the bottom line is this is how you improve as a trader no matter what level you are at. Data is everything in trading!
Fine Tuning Expected Value (EV)
We have looked at what EV is, how it is calculated and how to apply it to a trading strategy.
Now let us consider the impacts of trading higher quality setups within that strategy and betting exponentially on them and how that impacts EV.
Grading your setups and archiving them is a great way to see which ones have a higher probability of success.
Taking the bull flag trading strategy a step further, what if we learned through our data that a well-defined trendline that has been tested at least three times before breaking out increased your win rate by 5%?
When all the criteria lines up you have an A+ setup. This is the best chance for a successful trade so wouldn’t you want to place a bigger bet on it? I know I would.
Before we were risking $1k per trade. Now that we understand what makes an A+ setup, what if we decided to up our risk to $1,500 and our win rate jumped from 55% to 60% with an average win of $2,500. Here is what happens to EV:
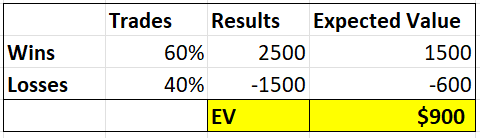
That’s a substantial jump from where we originally started.
The point is there is always room for improvement; you just need to know where to look and how to implement it.
How I Am Using EV in my Trading
I have recently been fine tuning a reversal trading strategy.
When working with a new strategy you obviously need to know where your risk is but you also need to understand where you should be taking profits like we discussed above.
I started digging into my archive of winning trades and missed opportunities to derive the maximum average amount of profit that was reached from my entry before the price retraced and the trade was closed, a concept known as Maximum Favorable Excursion (MFE).
I could then use that data to give me a better idea of what I should EXPECT to make on each trade.
Admittedly, the sample size is small, but these were the results over the past few months:
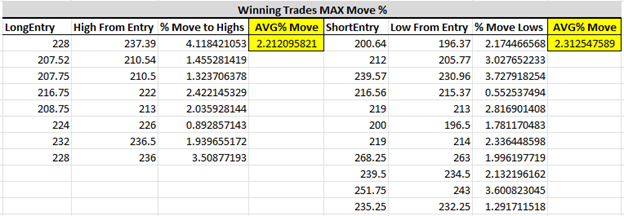
From the gathered data I concluded that I should expect around a 2% move over the long run on winning trades.
Therefore, I should be leaving a core part of my position on for that move, otherwise I will be eroding my edge, potentially even removing it all together.
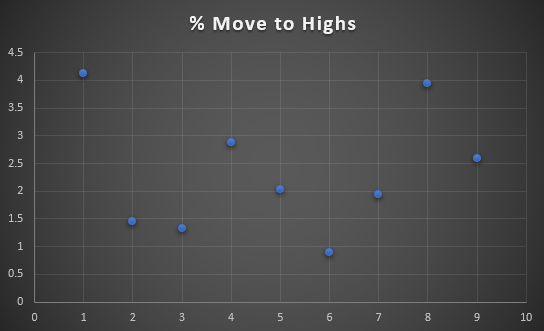
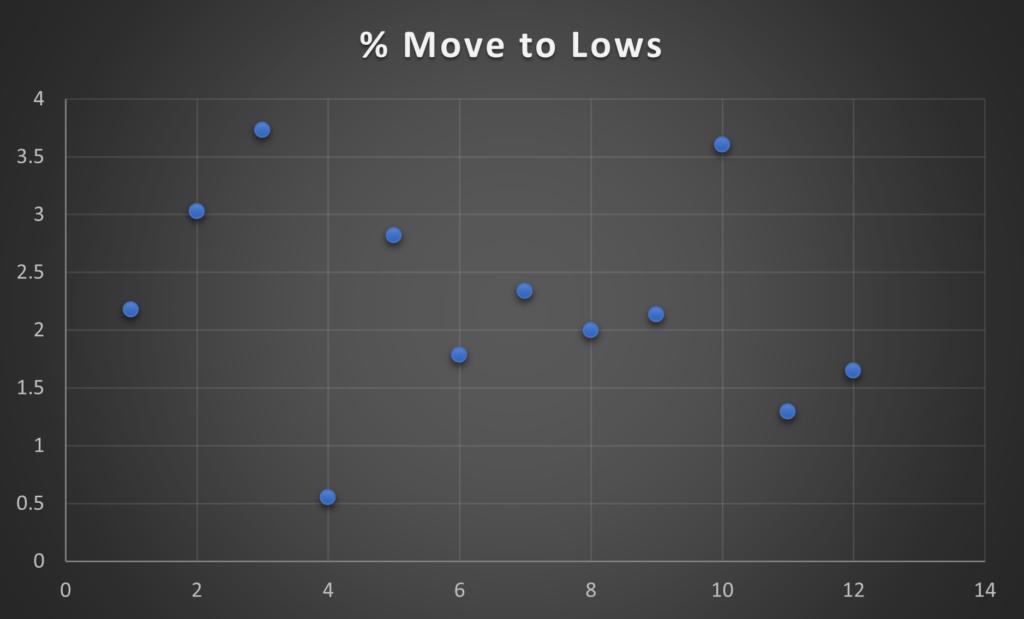
In the scatter charts above, you can see most of the grouping is around 2% with a few outliers above and below. This is a better visualization of the grouping and helps provide a more in-depth understanding of the data distribution.
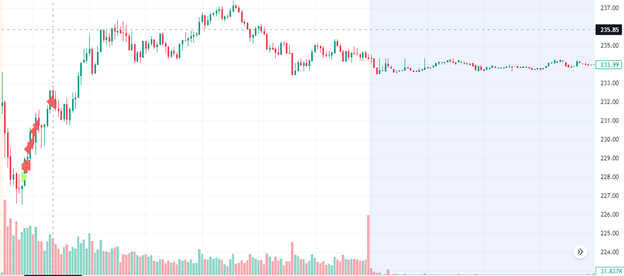
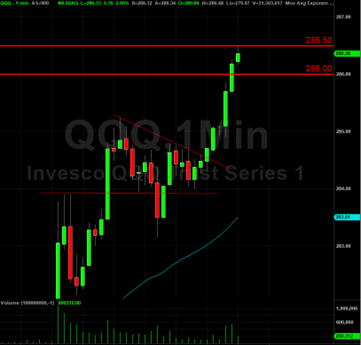
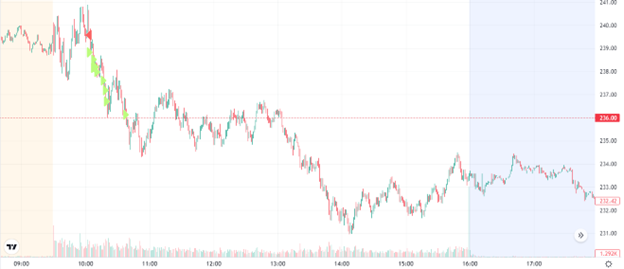
As you can see in this example, I have always been quick to take profits, however, this specific strategy is more of a position trade and requires a longer holding period than a scalp would to exploit it to its full potential.
With the new information I have obtained, I know I need to hold most of this position for the full 2% move to around $232.50. Obviously, this trade moved beyond that 2% target; leaving a quarter or a fifth of the position on for a bigger move should be considered.
With the short setup above, profits were taken too soon again. You may be thinking that I’m still making money and should be happy with that. However, the problem with that mentality is you are not taking into consideration drawdowns.
If this is a 50% win-rate strategy and I take profits on four trades at one “R” (Risk) and then I run into 4 losers, I will be back to even. But if I take profits at my EV which is roughly three to four R, then I am still well up on the strategy.
Maximizing opportunities is how you weather downturns and get ahead in your trading. This can’t be stressed enough. You HAVE TO put yourself in a position to catch the bigger move.
I know that is easier said than done. How can you stay bigger for longer? One thing that has helped me is writing out a trade plan which includes how much I will risk and how much profit I will take at certain levels.
For example, I may decide my goal is to take 25% off at PT1, 50% at PT2 or the Expected Value and then a 25% trailer. Having this game planned out ahead of time is a good way to implement it into your trading.
I will continue to collect data and hone this strategy to maximize opportunities, but this is a good start in understanding the potential of this setup.
Recent Example Using EV
As I was finishing up this post a great example showed up demonstrating the use of EV for picking the right stock to trade.
Bitcoin started running a couple months ago that ignited the entire crypto sector. Some of the main names were $COIN, $MARA and $RIOT that all started multi week runs.
This move brought in some FOMO traders that pushed them to extremes. When stocks become hyper extended there is usually a good opportunity for a contrarian or mean reversion trade.
The problem was they were all extended, so how do you know which name is the best to trade?
Lets look at the daily charts of $COIN, $MARA and $RIOT.
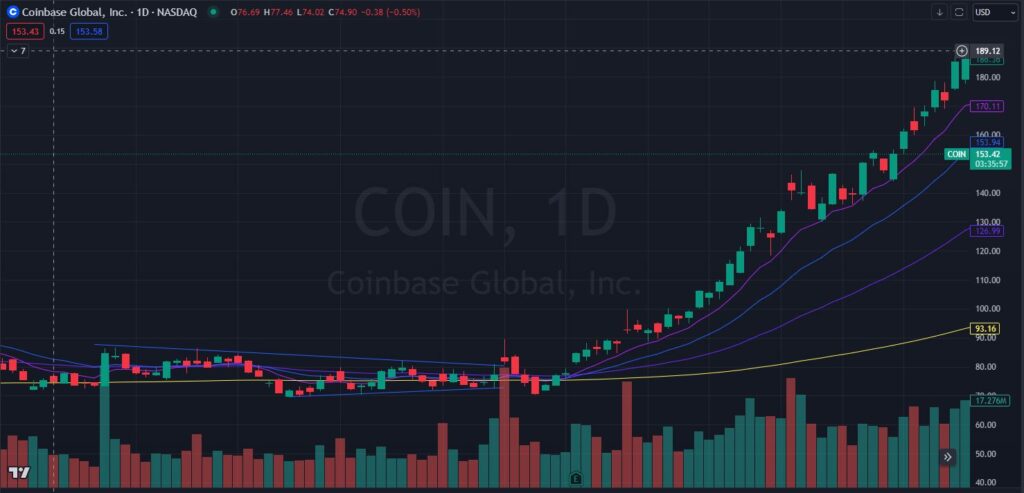
$COIN has had quite a run in the past few weeks and is now getting extended. However, the volume profile isn’t that great. You want to see more of an increase in volume as prices ramp up. $COIN didn’t have that look.
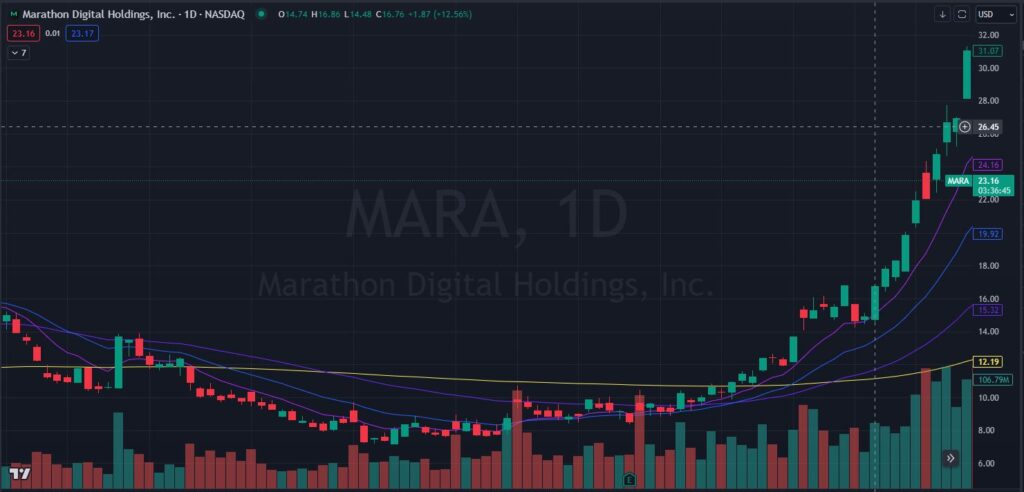
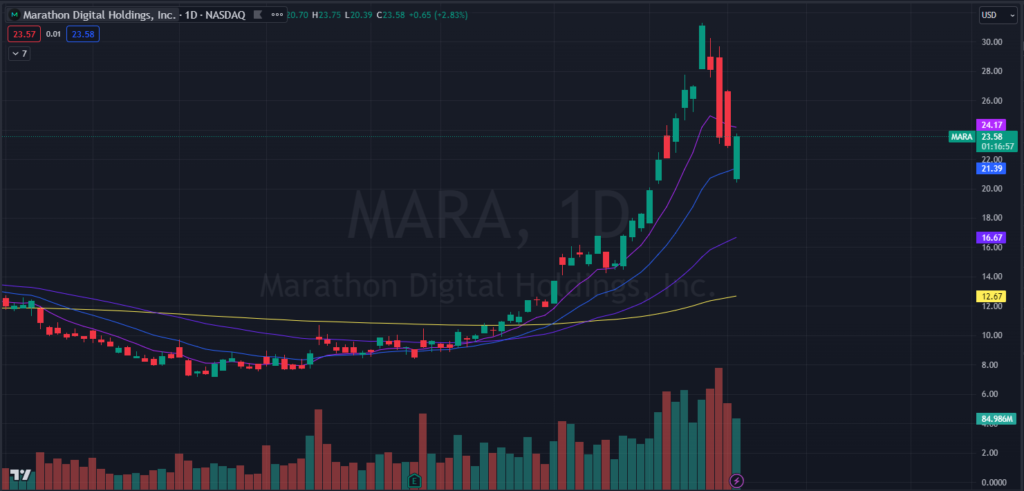
$MARA on the other hand had a really strong run on accelerating volume with wide range bars. This is the look you want to see for a capitulation/mean reversion trade.
Notice that it didn’t break a prior bar lows for multiple weeks. Also, take note of how steep it got into that last day. The more vertical the better.
The last day was mostly likely a bull trap. Pushing new highs on high volume and then closing right at highs. The following day, as you’ll see below, started the pullback, which trapped longs and accelerated the move down.
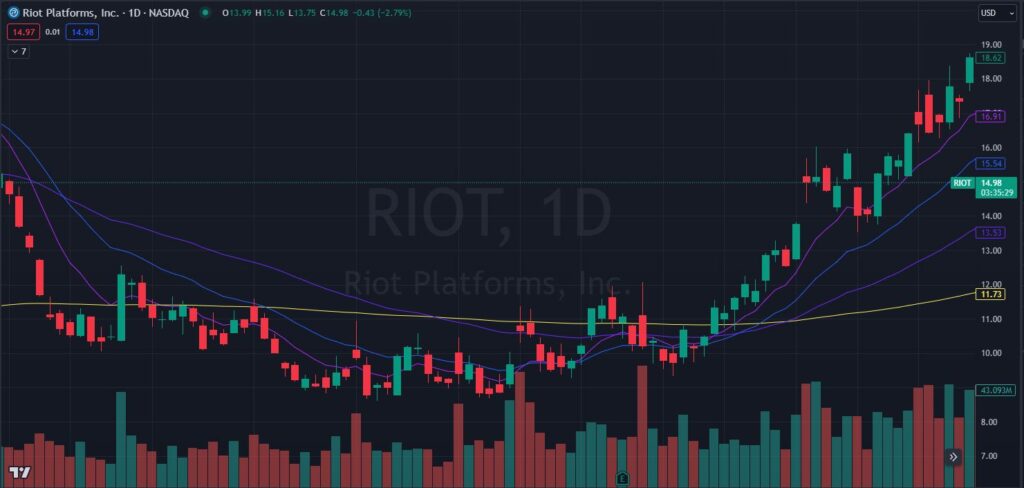
$RIOT has the worst looking chart of all them. Choppy, inconsistent price action without the accelerated volume or wide range bars.
So how does EV play a role in picking which stock to trade for a reversal?
Lets say that on capitulation trades the 10d EMA is the average pullback target. If that is the case and we took the high price to the 10d EMA, we would be looking at a 9.2% return for $COIN, 9.8% return on $RIOT and a 22.8% return on $MARA.
(I know we the possibility of top ticking the move is almost impossible. This is just for illustrative purposes.)
$MARA clearly has the better Expected Value in this case and should be the one you trade.
As you can see in the follow up chart below, $MARA hit the 10d EMA and gave us more. This was a great setup with excellent EV.
Its important to note that Expected Value is not a static number. It changes over time as the setup develops. If $MARA had another steep move higher you can argue that even more risk should be allocated to the trade given the increase in EV.
This type of thinking and analysis can be applied on all strategies.
Final Thoughts
This is the kind of work that needs to be done if you want to gain an edge in the market and be successful.
Trading random setups at random times of the day in random stocks will yield, you guessed it, random results.
Doing this work will give you consistency in your trading which in turn will boost your confidence for putting more size on.
Put in the work and you will be a much better trader than you were the day before.