JPYUSD Carry Trade
This isn’t going to be structured like any other write up I do; instead, I plan on using this more like a detailed journey entry on a market wide capitulation move to which I can then refer on future comparable opportunities.
The Situation
I won’t go into detail describing the carry trade; it’s been discussed ad nauseam on social media and there are people far more competent at doing so than I am. The best video I watched on this was Steven Place’s 8/3/24 market primer:
https://twitter.com/stevenplace/status/1819800539108139410
The basic gist is this: the yen has fallen against the dollar for the longest time because of the BOJ’s monetary policy which lay the groundwork for a profitable opportunity where one borrows yen, converts it into a different currency and uses that to buy assets (like US stocks). As it’s usually the case with such highly profitable trades that span decades, players employ a ton of leverage and get complacent. After the BOJ surprisingly hiked interest by 25bp on 7/31 to levels not seen in 15 yrs., the yen appreciated sharply against the USD which caused this trade to no longer be profitable; in order to unwind it, participants had to sell whatever assets they had bought.
US Market Context
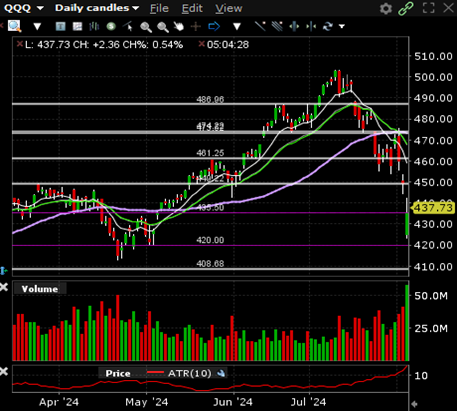
After finding a bottom from the last shallow pullback in April (~8%) the Qs rallied 21.9% over the next three months, mostly on the back of the AI trade; during that timeframe the sector leader NVDA went on its second major leg that saw the stock gain 86%, briefly becoming the most valuable company in the world.
The Qs peaked on 7/10 and followed that up with an engulfing red bar the next day after CPI data (CPI declined 0.1% from May, putting the 12-mo rate at 3.0%, its lowest level in more than three years). As a result, the probability of Fed rate cuts increased and a rotation from the leaders of this bull market (mega cap tech) into laggards (SMCs / IWM) ensued.
The Qs continued their downward trajectory with a few large intermittent gap downs, breaking all major short-term KMAs, retesting & rejecting them from below. Besides the rotation, negative Mag7 earnings surprises (e.g. TSLA & GOOGL, AMZN), geopolitical tensions, weaker macro data, and concerns about the ROI on massive investments in AI technology were all contributing factors before the Japan situation added fuel to the fire.
On 8/1, a day after the BOJ interest rate decision, the Nasdaq sharply rejected a key level and the short-term KMA cluster on an engulfing red bar on elevated volume. While weaker jobs data, recession fears, and concerns about the Fed again being too late (indicated by Fed Funds Futures pricing in a 50bp cut with near certainty in September) contributed to the weakness that day, the situation in Japan soon took center stage.
After a sizeable gap down on 8/2 (which was a Friday), the Qs gapped down massively on Monday after panic in Asian markets had taken hold over the weekend and the Nikkei made a historic move.
The Nikkei
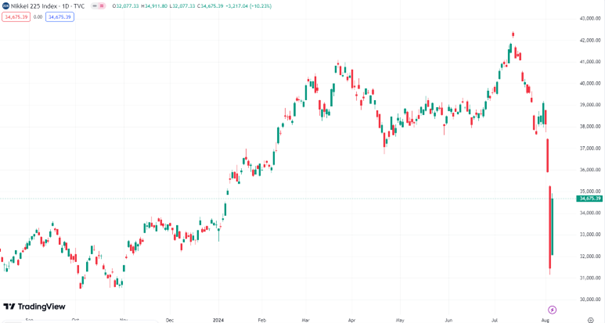
After dropping ~11% from YTD/ATH, the Nikkei consolidated for a week before testing the lows of that consolidation range on 8/1 and gapping significantly lower on 8/2. The index closed that day at dead lows, down 5.8%. Over the weekend, panic spread and the Nikkei experienced a repeat of the 1987 Black Monday, gapping down and closing near lows, 12.4% below PDC.
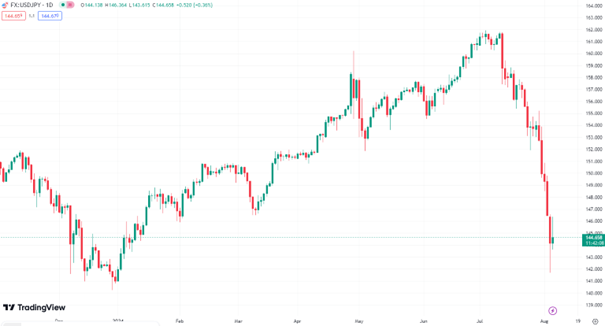
The main culprit behind these moves was the JPY which sharply appreciated against the USD.
My Weekend Prep
Nobody really saw a move of this magnitude coming but I thought the odds for a gap down were reasonably high and with how short-term extended US stocks were to the downside already going into the weekend, I believed if we gapped down on Monday and maybe even followed through with a little panic selling after the open, the ensuing bounce would make for a great opportunity.
I wanted to use the time over the weekend to prepare for that scenario to the best of my abilities. My prep work included a) studying historical patterns for how bottoms after sharp, brief corrective moves played out both on the daily and intraday chart and b) identifying the stocks that were stretched the most and thus set up best for a sharp move in the opposite direction (generally, when market-wide selling is taking place and emotions run rampant, I want to position in the stocks where the rubber band is stretched to its limits and snaps back viciously once the turning point is reached. That’s where the highest EV resides).
I made a comprehensive list of all major corrections over the last decade and while I won’t mention them all here, these were the two examples I thought applied best to the situation at hand:
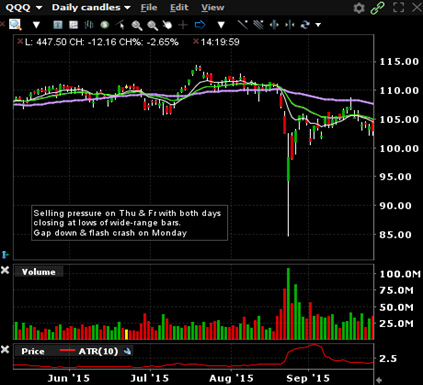

This was an interesting precedent because the catalyst was somewhat comparable (a major Asian market getting nuked which spilled over into US markets, a topping pattern/weakness before the capitulation, and panic taking place over the weekend culminating on Monday). This too was a sharp 3-day move with consecutive gap downs that resulted in an insane flush at the open on Monday.
The Covid crash, specifically the first leg lower 2/28/20 | -16.6%

I was particularly interested in the first leg of the Covid crash because a) the bounce after the first leg of a bear market is usually the sharpest and b) it shared a lot more similarities with this week’s PA- While the Qs had already sold a good amount from ATHs this was technically the first leg lower based on the catalyst that was the driving force behind the momentum of the last couple of days.
These two examples highlighted the stark difference between intraday PA on the day the index bottomed. The more comprehensive study I did revealed that bottoms are rarely found on clean price and volume capitulation; rounded bottoms and wide-range intraday chop with a strong move to/through HOD in the second half of the day are a lot more common which makes trading these very difficult – you generally cannot tell whether this is THE bottom or just another day where initial gains will later be reversed because you never get the tell-tale signs of a bottom (capitulation in both price & vol).
The reason why I thought the 2022 bear market wasn’t a great comparison is because the break this week (for the most part) took place as the result of an exogenous shock rather than an internal crisis.
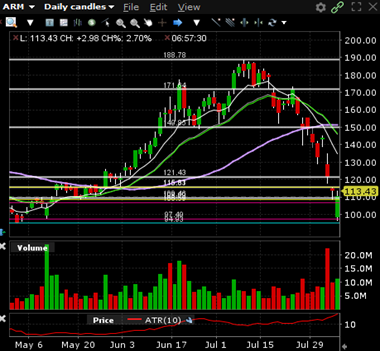
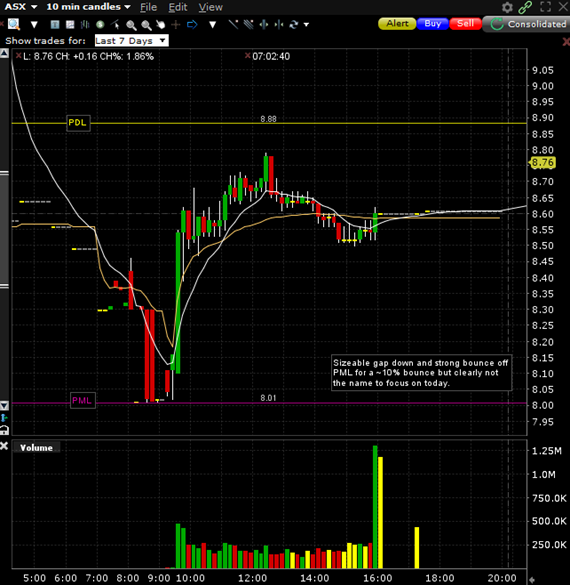
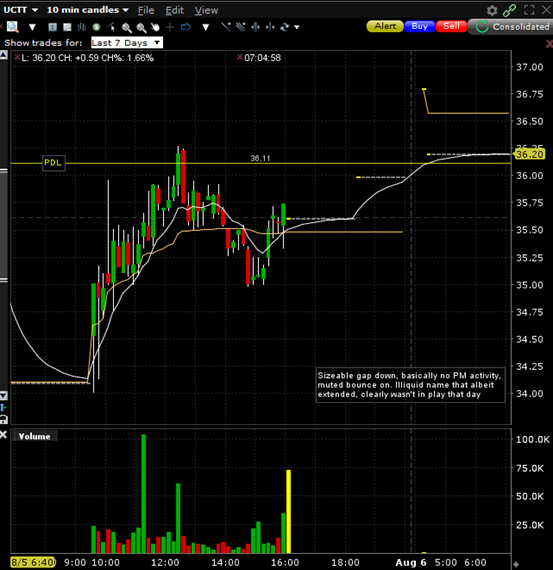
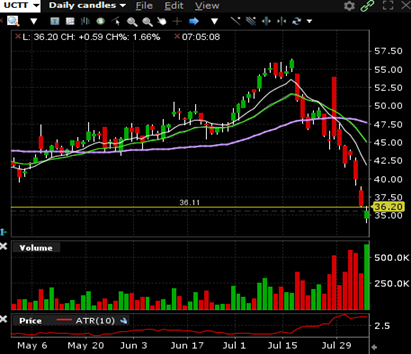
The second half of my prep work involved identifying the names with the most potential for a sharp bounce. Semis & semi-related names had led the market higher for over a year on the back of the AI trade; they had also led on the back side during the last couple of weeks with many of these names having pulled back significantly (30-50% range) off YTD highs. They were the most in-play and looked the ugliest and were thus going to be my focus.

My favorites amongst the more liquid names were MU & ARM with ASX & UCTT as more illiquid sleeper picks (OE rating = order of preference).
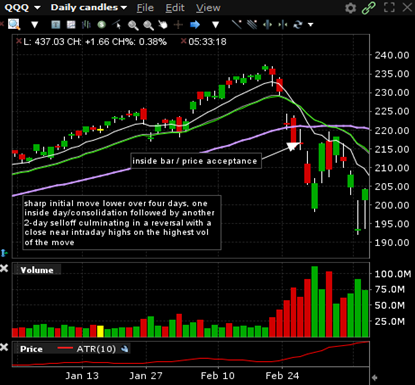
The reason why I wasn’t particularly interested in the most popular names (NVDA, AMD, SMCI) is because of their daily charts – they had pulled back a good amount too but there was no real sign of capitulation: every other large-range red candle was followed by another multi-day consolidation or an inside bar indicating price acceptance. These simply lacked proper multi-day extensions.
Additionally, I ran a couple simple scans for stocks down the most (in % terms) over the last month and compiled another watch list in addition to my focus list (favorites highlighted in yellow):
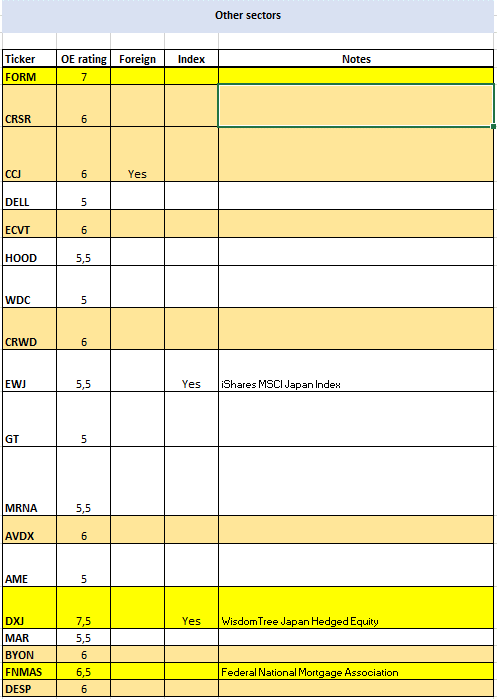
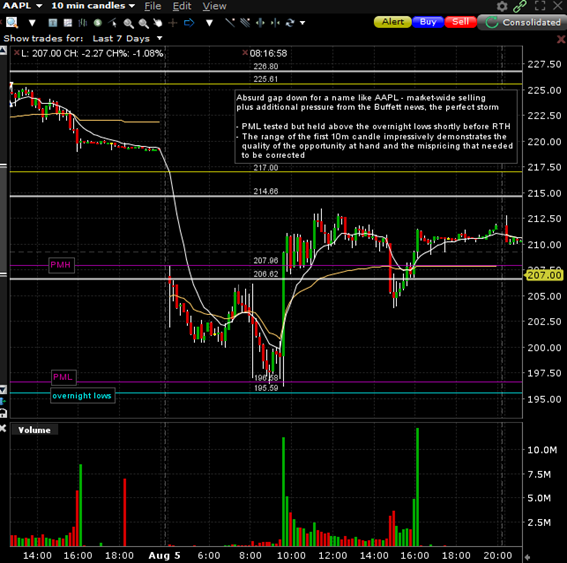
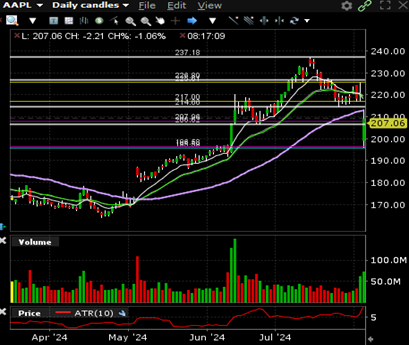
AAPL was another name that I added to my list later that weekend after the Buffett headlines were published because I thought that could add some irrational selling pressure. A value investor selling half of his position in a stock that has appreciated >300% from his cost basis with it being by far the largest position of his portfolio shouldn’t come as a shock.
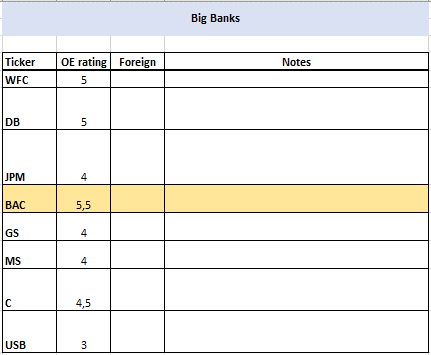
Big banks were somewhat interesting too since they had started a steep selloff following the beginning of the unwind of the carry trades. None of these looked particularly enticing on the daily chart with BAC being my clear favorite. The headline about Buffett having sold a good amount of stock in that name over the weekend too made me all the more interested in a trade on it and moved it towards the top of my FL.
QQQ Intraday Chart

As so often when something breaks, peak panic takes place before the market opens and that’s when the lows are made. The Qs had managed to find some support in the $427.5 range during PM but broke that level roughly an hour before the market opened and waterfall selling ensued. Price and volume both expanded heavily with volume peaking on an engulfing green bar that marked the turn. This single 5m bar had a range of over 1% after the Qs had already fallen 6% from PDC; truly remarkable.
From there, the index bounced back towards the $427.5 level where it found some resistance, opening slightly lower. After a brief dip at the open, the Qs caught a strong bid, broke through PM resistance and experienced a strong OD that took the index all the way through PMH, a >4% move off PML. The odds for the low being in were rather high at this point.
The Qs topped at $442.29, erasing almost all of the day’s losses before pulling back in the afternoon and rallying strongly into the close, finishing the day in the upper third of the intraday range (good sign for continuation).
It’s important to note that the Nikkei had bounced strongly into its close and had continued higher AH, indicating the (temporary) low in Japan was likely found. With the panic in US markets taking place “only” because of contagion, the odds for a bounce became better the lower we went.
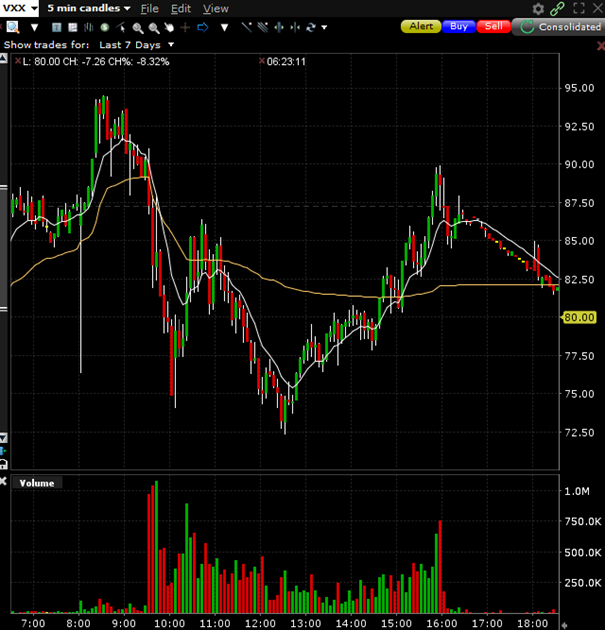
The VXX – a good sentiment gauge – had topped in the PM but opened near PMH only to sell off sharply during the first 30m when indexes started rallying. Curiously, it rallied into the close despite SPY still trading in the upper half of its intraday range; someone was likely still taking massive heat on their positions and needed out.
Sentiment during the PM hours of 8/5:

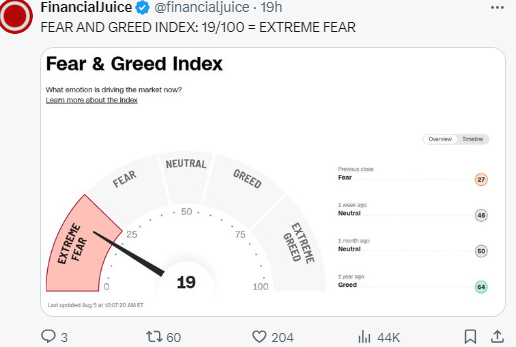
Emotions were clearly taking the reins which usually leads to irrational decision-making amongst market participants which then results in major inefficiencies.
How I Traded it
As per usual on the best days of the year I was traveling, this time by car but the internet on mobile wasn’t exactly great either; day trading was definitely out of the picture. The only way I could participate was by playing the big picture. I decided I was going to go long MU & BAC and this was going to be one of those very rare exceptions where I wasn’t going to use a stop but would size in a way that would allow me to add to my positions lower should things get even more irrational. Unfortunately, it didn’t come to that.
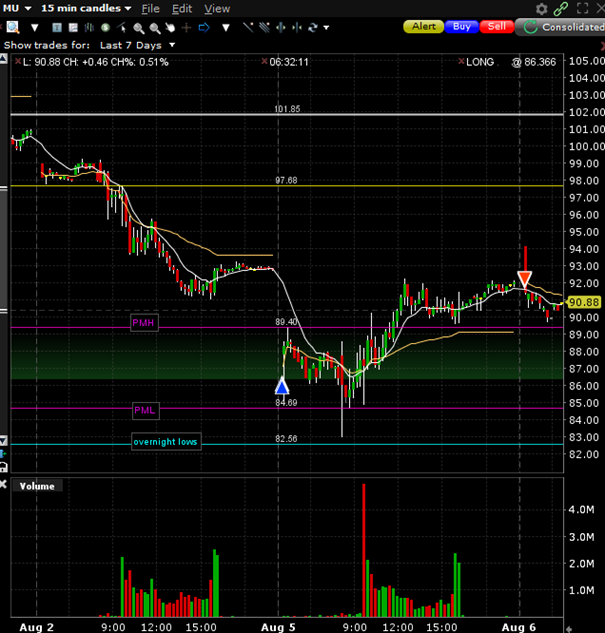

I bought MU at 4am when it was already trading well above its overnight lows. In hindsight, that made it a much less attractive choice and ARM would’ve been a better target (that too only closer to the open, not at 4am). I had planned on doubling down in the low $80s and doubling that again should things get completely unhinged and we’d see $70s.
I’d be lying if I didn’t admit that the follow-through on MU was rather disappointing. It was struggling the second the market opened and needed much more time to make new highs. With the way both indexes and MU closed I felt comfortable holding the whole position overnight. I sold half into the (again disappointingly small) gap up and plan on holding the second half for a move towards the mid/high $90s.


I had even higher conviction in this name. BAC is an extremely boring stock and for it to gap down 12% after already having made an extensive move over the last couple of days with three consecutive gap downs I felt very comfortable buying at these levels and would’ve loved a chance to add lower.
Long at 4am, BAC immediately caught a strong bid but one large seller showed up during the last hour of PM trading. My internet was too bad to watch the tape but when BAC undercut the PML and bounced strongly on elevated volume, I added.
Great PA during RTH with a strong bounce, minimal p/bs and a close near highs. Sold half into the small gap up today, holding the second half for a bigger move towards $38.
How I Should’ve Traded it
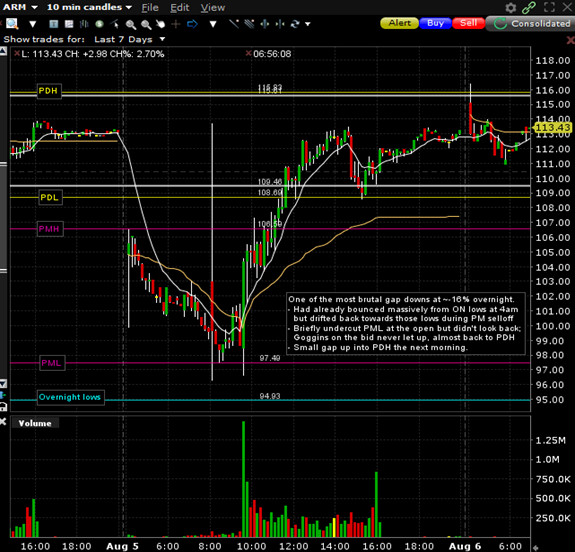
Honestly think I did alright given the circumstances. The main flaw I identified in hindsight was stock selection: while MU had been my favorite amongst the liquid semi names, the size (or lack thereof relative to other names in the sector) of its gap down should’ve moved it down my priority list and put ARM in its place.
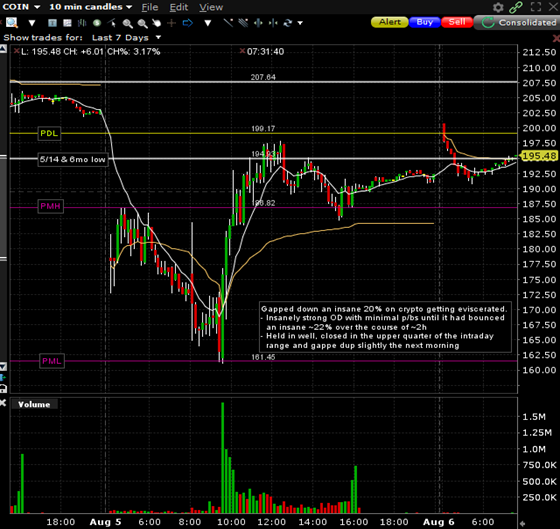
Additionally, AAPL below $200 was a screaming buy similar to BAC, I should’ve participated there too. Lastly, there’s crypto and crypto-related names; the sector got completely eviscerated after already having pulled back for weeks. These too were prime targets for a reversal trade.
How my Focus Ideas Played out / the Top Movers:

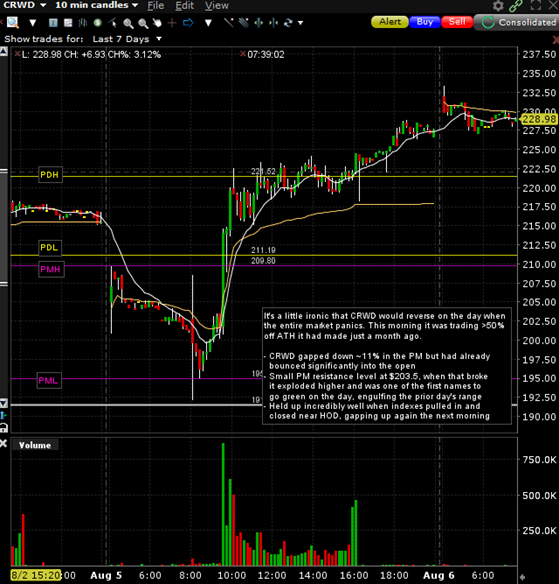
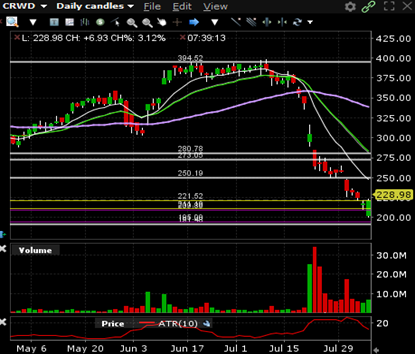
The picture on my watch list composed of names outside the semi sector/AI trade was very similar with the most popular names also being the most in-play stocks. Despite a lot of smaller names having made big moves, the FT was cleaner and more pronounced on the better-known names which, in retrospect, makes a lot of sense. Would you rather want to buy a best-in-breed name or a C-tier company when both stocks are roughly down the same % amount on the same market-wide catalyst?
A couple other names that made outstanding moves:
Crypto-related stocks. The whole sector staged an incredible bounce, I’ll just mention COIN as the most popular/liquid representative.


Lessons learned
- Proud of the prep work I put in, helped me a lot narrowing down my focus list and doing scenario planning; however, I cannot trade the names I have identified as the most attractive targets with blinders on. The situation evolved over the weekend, new information came to light and not all names responded similarly. For instance, I should’ve shifted my focus from MU to ARM and included AAPL & COIN in my focus list.
- On days where the entire market is panicking, you want to be focusing on the liquid leaders as opposed to smaller names regardless of their daily charts. Once buyers start to step in, those will be the names where most of the money will flow to and smaller names will respond more passively to the rallies taking place in indexes/bigger names. Identify the liquid leaders with the charts set up best for a reversal and focus on those
What’s to come:

Fairly confident we’ve seen peak panic but that doesn’t mean we won’t make new lows eventually. Still a lot of uncertainty out there between recession fears, Fed policy, geopolitical uncertainty and the continued unwind of the JPYUSD carry trade.